
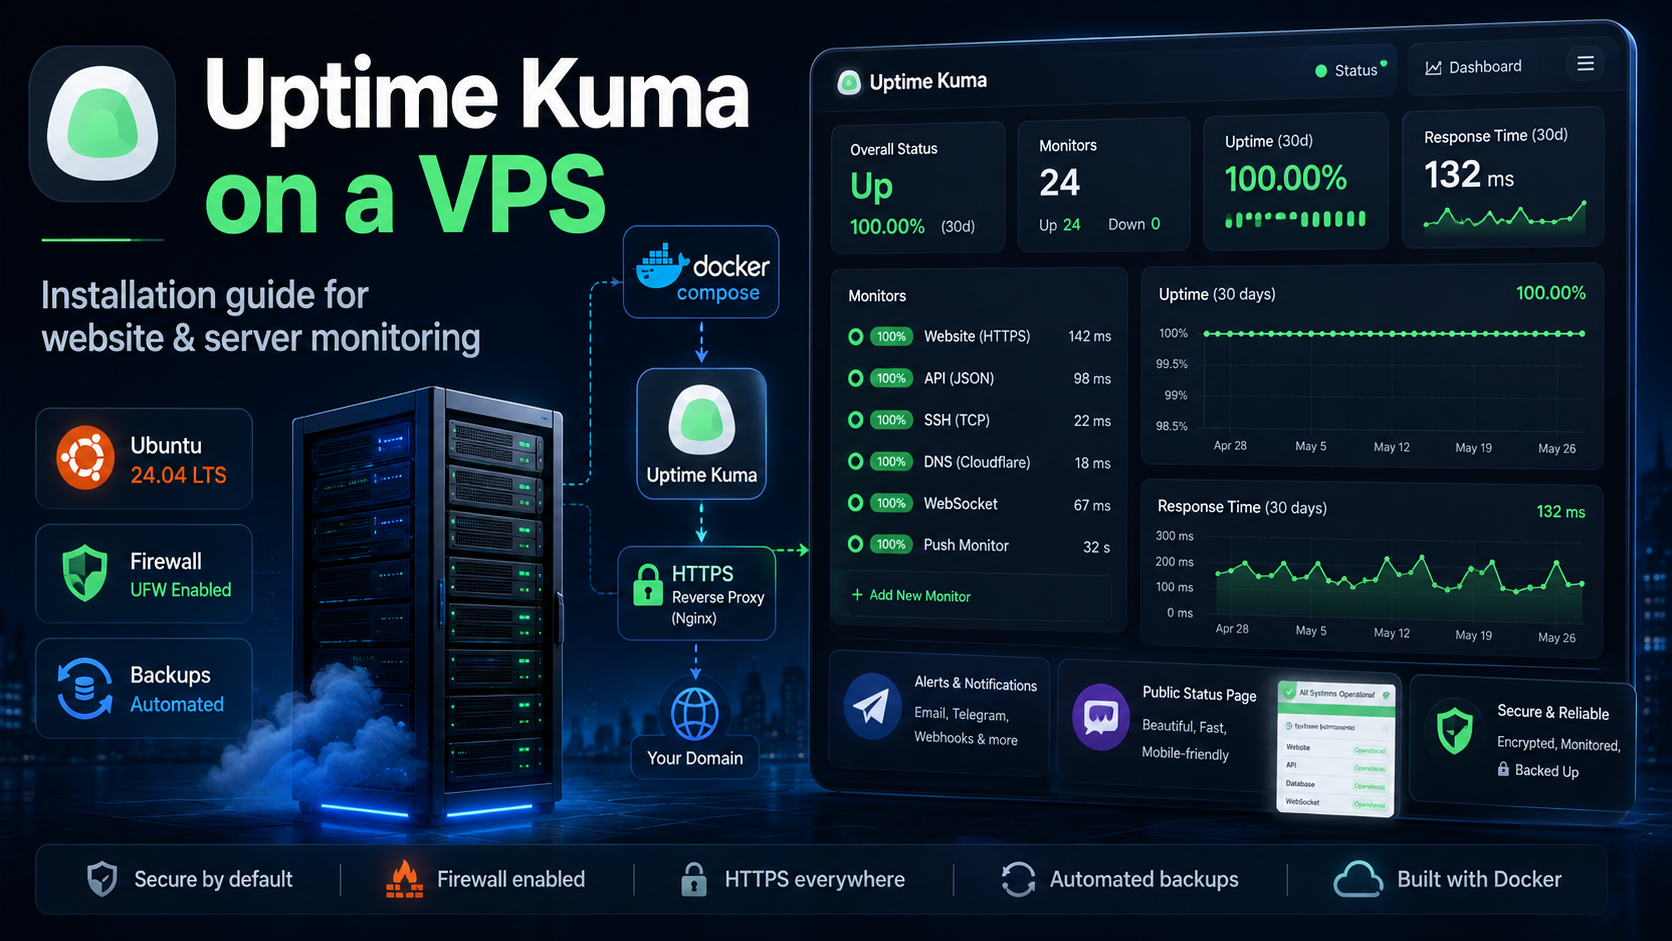
Uptime Kuma: setting up your own website monitoring on a VPS
A website can break while continuing to return 200 OK. A backup can stop running without an obvious error. Uptime Kuma detects both cases: it checks websites, APIs, ports, and background jobs, then sends a notification when something goes wrong.
We will cover where to host the monitoring system, what kind of VPS it needs, and how to install Uptime Kuma 2, enable HTTPS, connect Telegram, and create a status page.
Uptime Kuma in seven steps
- Allocate a small VPS separately from the projects being monitored.
- Point a subdomain such as
monitor.example.comto it. - Install Docker and start Uptime Kuma 2.
- Close the internal port
3001and enable HTTPS. - Create HTTP, DNS, TCP, or push monitors.
- Configure Telegram and, when needed, a status page.
- Set up updates and an external backup of the data directory.
What is Uptime Kuma
Uptime Kuma is a free, open-source, self-hosted tool. Its dashboard and check history are stored on your own server.
It can monitor HTTP(S), TCP ports, ping, DNS, WebSocket, text and JSON in responses, push signals, and Docker containers. The minimum check interval is 20 seconds. It also offers dozens of notification channels, 2FA, latency charts, TLS certificate monitoring, and multiple status pages.
How to detect a failure hidden behind 200 OK
A basic HTTP check only sees the response code. However, a web server can display a blank page or an application error screen and still return a successful status.
For more accurate monitoring, use:
- Keyword — looks for an expected phrase, such as the website name or the text “Account dashboard”;
- JSON Query — checks a value in an API response, for example
status: healthy.
This way, the monitor confirms not only that the port is reachable, but also that the application shows at least one expected sign of correct operation.
Push monitor for backups and cron jobs
A push monitor does not poll a service. Instead, it waits for a regular signal from that service. A backup script or cron job calls a unique URL after it finishes successfully. If the signal does not arrive on time, Uptime Kuma reports a failure.
This helps detect a “silent” problem: the website is still working, but the daily backup has not been created for several days.
What Uptime Kuma does not replace
Uptime Kuma primarily tracks availability and response time. For CPU, RAM, disk, logs, and container metrics, complement it with Prometheus, Netdata, Zabbix, or another monitoring system: Kuma notices the problem from the outside, while metrics help identify the cause.
Why monitoring should run on a separate VPS
If Uptime Kuma is installed next to the website, a failure of the VPS, network, or data center can take down both the project and the monitoring system. The notification may never be sent.
Host the dashboard on a separate VPS and, for important projects, in another location or with another provider. It is also useful to monitor Kuma itself with an external service: someone needs to watch the monitoring system too.
Uptime Kuma server requirements
The project does not define a strict official minimum for CPU and RAM. A practical starting configuration for a small installation is:
- 1 vCPU;
- 1 GB RAM;
- 10 GB SSD;
- Ubuntu 24.04 LTS;
- IPv4;
- a domain or subdomain for HTTPS.
This configuration is usually enough for several dozen simple checks. For hundreds of monitors, long history retention, or browser-based checks, choose 2 GB RAM or more.
How to install Uptime Kuma on a VPS
This example uses Ubuntu 24.04 and the subdomain monitor.example.com.
1. Configure DNS and the firewall
Create an A DNS record pointing to the VPS IPv4 address. Connect over SSH and open the required ports:
ssh root@SERVER_IP
apt update && apt upgrade -y

ufw allow OpenSSH
ufw allow 80/tcp
ufw allow 443/tcp
ufw --force enable
Do not close the current SSH session until you have tested a new connection.
2. Install Docker and Docker Compose
apt install -y ca-certificates curl
install -m 0755 -d /etc/apt/keyrings

curl -fsSL https://download.docker.com/linux/ubuntu/gpg \
  -o /etc/apt/keyrings/docker.asc
chmod a+r /etc/apt/keyrings/docker.asc

tee /etc/apt/sources.list.d/docker.sources > /dev/null <<EOF
Types: deb
URIs: https://download.docker.com/linux/ubuntu
Suites: $(. /etc/os-release && echo "${UBUNTU_CODENAME:-$VERSION_CODENAME}")
Components: stable
Architectures: $(dpkg --print-architecture)
Signed-By: /etc/apt/keyrings/docker.asc
EOF

apt update
apt install -y docker-ce docker-ce-cli containerd.io \
  docker-buildx-plugin docker-compose-plugin

docker compose version
3. Start Uptime Kuma 2
mkdir -p /opt/uptime-kuma
cd /opt/uptime-kuma

cat > compose.yaml <<'EOF'
services:
  uptime-kuma:
    image: louislam/uptime-kuma:2
    restart: unless-stopped
    ports:
      - "127.0.0.1:3001:3001"
    volumes:
      - ./data:/app/data
EOF

docker compose up -d
docker compose ps
Use the :2 tag: latest is still assigned to the outdated v1 branch. The /app/data directory must be stored on a local disk or a regular Docker volume. NFS and storage systems without proper file locking can corrupt the database.
Port 3001 is accessible only on 127.0.0.1. A reverse proxy with HTTPS will publish the dashboard externally.
4. Enable HTTPS with Caddy
apt install -y caddy

cat > /etc/caddy/Caddyfile <<'EOF'
monitor.example.com {
    reverse_proxy 127.0.0.1:3001
}
EOF

caddy validate --config /etc/caddy/Caddyfile
systemctl reload caddy
If DNS points to the VPS, Caddy will automatically request a TLS certificate and proxy WebSocket connections. Host the dashboard at the root of a domain or subdomain: an address such as example.com/kuma is not supported.
5. Create the administrator account
Open https://monitor.example.com, create an account with a long, unique password, and enable two-factor authentication.
How to add the first monitor
Click Add New Monitor and select HTTP(s):
- Enter a name and the full URL.
- Set an interval, for example 60 seconds.
- Add two retries to handle occasional network failures.
- Select a notification channel.
- Save the monitor and confirm that successful checks begin to appear.
For the main website, HTTP and Keyword checks are useful. For an API, use a health endpoint and JSON Query. Do not expose databases or administrative ports to the internet solely for monitoring; use a trusted network or VPN.
Push monitor example for a backup
After creating a Push monitor, add its unique URL to the end of the script:
backup-command && \
  curl -fsS "https://monitor.example.com/api/push/SECRET_TOKEN?status=up&msg=backup-ok"
The request runs only after a successful backup. Treat the push token like a password: anyone who knows the URL can send a false signal.
How to connect Telegram
Create a bot through @BotFather, send it a message, then open Settings → Notifications → Telegram. Enter the Bot Token and Chat ID, click Test, and assign the channel to your monitors. For critical services, add a second channel such as email.
How to create a status page
In Status Pages, you can group monitors, display current status and uptime history, assign a domain, and report planned work through Maintenance. Do not publish internal IP addresses or technical URLs: customers only need components such as “Website,” “API,” “Account dashboard,” and “Payments.”
Updating and backing up Uptime Kuma
Before a major update, stop the container and save the data directory:
cd /opt/uptime-kuma
docker compose down

tar -czf /root/uptime-kuma-$(date +%F).tar.gz \
  data compose.yaml

docker compose up -d
Move the archive to another device or external storage. A copy on the same VPS does not protect you from server deletion or disk failure.
For a regular update:
cd /opt/uptime-kuma
docker compose pull
docker compose up -d --force-recreate
After startup, check docker compose ps, open the dashboard, and send a test notification.
Which VPS to choose for Uptime Kuma
A small installation only needs a Linux VPS with 1 vCPU and 1 GB RAM. Independence matters more than raw performance: the monitor must keep running when the main project is unavailable.
You can host Uptime Kuma on a VPS from tropic.host when the monitored services run on another platform or independent node. Ubuntu, Docker, and a static IP make it quick to launch the dashboard, while resources can be increased as the number of checks grows.
If production already runs in the same infrastructure, choose another node or add an external backup monitor. Separating failure domains is more useful than adding an extra CPU core.
Common mistakes
| Mistake | Why it is a problem | Better approach |
|---|---|---|
| Monitoring runs next to the project | A shared outage takes down both the service and notifications | Use a separate VPS or location |
Port 3001 is publicly exposed | The dashboard is accessible without a reverse proxy or HTTPS | Bind the port to 127.0.0.1 |
Only the 200 status code is checked | An application error can look like success | Add Keyword or JSON Query |
The latest tag is used | It points to the outdated v1 branch | Use louislam/uptime-kuma:2 |
| The backup is stored on the same VPS | It will disappear together with the server | Copy the data directory elsewhere |
Summary
Uptime Kuma turns a small VPS into your own monitoring center for websites, APIs, DNS, ports, certificates, and background jobs. Keyword helps detect a broken page, JSON Query catches an incorrect API response, and Push reveals a stopped backup or cron job.
For a reliable setup, host the monitoring system separately from production, close port 3001, enable HTTPS and 2FA, and configure two notification channels. Then set up an external backup of the data directory and an independent check of Uptime Kuma itself.
FAQ
Is Uptime Kuma free?
Yes. The project is open source and distributed under the MIT license. You only pay for infrastructure, the domain, and external backups.
How much RAM does Uptime Kuma need?
For a small installation, 1 GB RAM is a sensible starting point. For hundreds of checks, long history retention, or Browser Engine, allocate 2 GB or more.
Can Uptime Kuma be installed without Docker?
Yes, using Node.js and PM2. However, Docker Compose is usually easier to update, migrate, and restore on a VPS.
Can Uptime Kuma be used without a domain?
Technically, yes—through the IP address or an SSH tunnel. For permanent internet access, a subdomain with HTTPS is safer.
Does Uptime Kuma show CPU, RAM, and disk usage?
Not as a full-featured server metrics system. For server resource monitoring, complement it with Prometheus, Netdata, Zabbix, or another specialized tool.